Attention mechanisms in Transformers inherently provide a form of interpretability via weight visualization.
— by
Steven Haynes
Outline
Introduction: The “Black Box” problem and why Attention is the bridge to transparency.
Key Concepts: Understanding Query, Key, and Value vectors and the attention map.
Step-by-Step Guide: Extracting, normalizing, and visualizing attention weights.
Examples: Analyzing machine translation and document summarization.
Common Mistakes: The “Attention is not Explanation” fallacy and confounding factors.
Advanced Tips: Using Integrated Gradients alongside attention and multi-head analysis.
Conclusion: Balancing interpretability with performance.
Peering Inside the Transformer: How Attention Mechanisms Unlock Model Interpretability
Introduction
For years, the field of deep learning suffered from the “Black Box” dilemma. As models grew into billions of parameters, they became performant yet opaque; we knew the input and the output, but the internal reasoning remained hidden. With the rise of the Transformer architecture, this changed. The Attention mechanism, the backbone of modern AI, does not merely transform data—it explicitly maps the relationship between words. By visualizing the weights of these connections, developers and researchers can finally peek under the hood to see exactly which tokens a model prioritizes when generating an answer.
Understanding these mechanisms is no longer just for research scientists. For practitioners building production-grade AI, attention visualization is an essential diagnostic tool. It allows you to debug bias, understand model hallucinations, and build trust with stakeholders who need to know why a model made a specific prediction. This article explores how you can leverage attention weights to move from blind faith in deep learning to empirical, transparent AI development.
Key Concepts
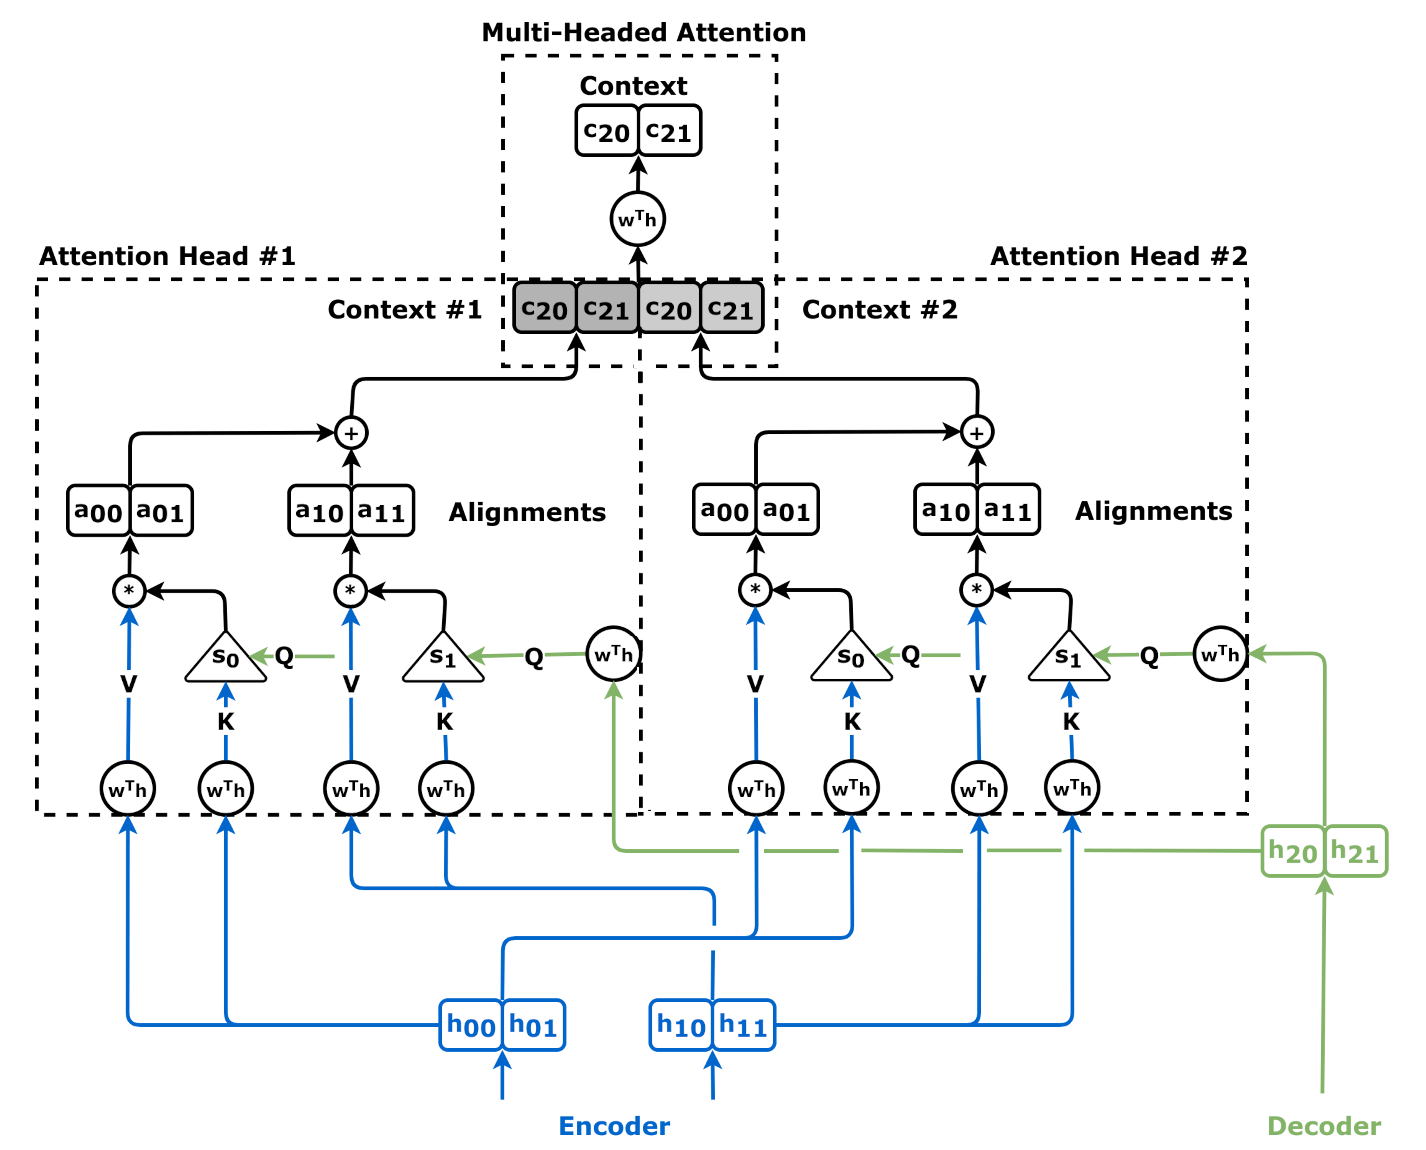
To understand why attention is interpretable, we must look at how the Transformer processes input. Every time a Transformer handles a sequence of words, it calculates three vectors for each token: Query (Q), Key (K), and Value (V).
The attention mechanism computes a score—typically via a dot product—between the Query of one token and the Keys of all other tokens in the sequence. These scores are normalized (usually via Softmax) to create “attention weights” that sum to one. These weights tell us, mathematically, how much “focus” the model is placing on token B when it is currently processing token A.
Attention is essentially a dynamic, learned weighting scheme that reveals the model’s focus at every layer.
Crucially, because Transformers are modular—containing multiple “heads” per layer—you don’t just get one perspective. You get a multi-dimensional view of how the model interprets grammar, syntax, and semantics simultaneously. One head might focus exclusively on noun-verb agreement, while another might look for distant anaphora (pronouns referencing earlier entities).
Step-by-Step Guide: Visualizing Attention
You can extract and visualize these weights using standard libraries like Hugging Face Transformers and Captum. Follow this process to begin your analysis.
Extract the Attention Scores: When running your model, set output_attentions=True in your model configuration. This returns a tuple of tensors containing the attention weights for every layer and every head.
Aggregate Across Heads: A single model can have dozens of heads. To get a high-level view, compute the mean attention weight across all heads for a specific layer.
Normalize the Weights: Since raw scores can be noisy, apply a normalization technique (such as Min-Max scaling) to ensure the heatmaps have high visual contrast.
Map to Tokens: Use a library like BertViz or generate a simple heatmap using Matplotlib. Map your normalized weights to the input token sequence using a tokenization index (e.g., WordPiece or BPE tokens).
Analyze Layer Variance: Compare layers. Often, lower layers focus on local syntactic structure (adjectives modifying nouns), while deeper layers focus on global context and complex logical dependencies.
Examples and Real-World Applications
Machine Translation: In a Transformer-based translation model, attention maps provide instant verification of alignment. If you are translating “The cat sits on the mat” to a target language, you can visualize the attention matrix. If the model is correctly mapping “cat” to the corresponding noun in the target language, you know the attention mechanism is capturing the semantic intent correctly.
Document Summarization: When using a model like BART or T5 to summarize long-form legal documents, attention visualization helps identify if the model is focusing on key clauses or irrelevant filler. If the heatmap shows the model ignoring the “limit of liability” section, you have a clear diagnostic signal that your model’s summarization performance will be legally unsound.
Bias Mitigation: If you suspect your model is biased—for instance, associating certain professional roles with specific genders—you can isolate the heads that activate most strongly on these tokens. By examining the weights, you can empirically prove that the model is using gendered pronouns to inform its decision-making, providing the data needed to perform targeted fine-tuning or debiasing.
Common Mistakes
The “Attention is Explanation” Fallacy: It is a common mistake to assume that high attention weights automatically equal “causality.” Just because a model attends to a word does not mean that word was the sole driver of the output. Attention is a snapshot of association, not a definitive map of logic.
Ignoring Multi-Head Diversity: Looking only at the average attention across all heads washes out the nuance. You might miss specific heads that are detecting critical patterns because they are being drowned out by “noisy” heads that focus on punctuation or stop words.
Confusing Input for Output: Attention weights are often computed relative to the input sequence. Do not conflate this with internal activation patterns in the feed-forward layers, which capture the actual knowledge encoded in the model.
Advanced Tips
To move beyond simple visualization, integrate Attention Rollout or Attention Flow. Because Transformers have multiple layers, a word at layer 1 affects layer 2, which affects layer 3. Simply looking at layer 12 gives you the final output’s focus, but it doesn’t show you the path of information flow. Attention Rollout computes the cumulative attention across layers, giving you a more accurate representation of which input tokens genuinely influenced the final state.
Furthermore, pair your attention visualizations with Integrated Gradients. While attention tells you where the model is looking, Integrated Gradients tell you how much the output changes if you perturb a specific input. If a high attention weight coincides with a high gradient attribution score, you have found a reliable, evidence-backed feature that the model uses for its decision-making process.
Conclusion
The interpretability afforded by Transformer attention mechanisms is one of the most significant advancements in the history of deep learning. By moving away from the “Black Box” mindset and embracing the granular visibility of attention weights, we can transform AI from a magical, unpredictable utility into a rigorous, verifiable engineering discipline.
However, interpretability is not a silver bullet. Use attention visualization as a diagnostic aid—a compass to point you toward where your model is succeeding and where it is struggling. When combined with rigorous evaluation metrics and gradient-based attribution, attention visualization provides the most robust pathway currently available for building AI systems that are as transparent as they are powerful. Start small: visualize your model’s attention on your next project, and you will undoubtedly find insights that aren’t visible in the aggregate error metrics alone.


Leave a Reply