Color theory should be applied to distinguish between model confidence levels.
— by
Steven Haynes
Outline
Introduction: The hidden challenge of model uncertainty in UI/UX design.
Key Concepts: Understanding the psychology of color as it relates to probabilistic outputs.
Step-by-Step Guide: Implementing a semantic color system for confidence intervals.
Real-World Applications: AI chatbots, medical imaging, and financial forecasting.
Common Mistakes: Over-saturation, accessibility failures, and cognitive overload.
Advanced Tips: Combining color with iconography and micro-animations for clarity.
Conclusion: Why design is the final layer of AI interpretability.
Visualizing Uncertainty: Applying Color Theory to Model Confidence Levels
Introduction
We are living in an era defined by artificial intelligence, where model outputs—from simple text predictions to complex diagnostic probabilities—are integrated into almost every digital tool. Yet, a fundamental flaw persists in many interfaces: they present high-confidence facts and low-confidence guesses with the same visual authority. This lack of transparency leads to “automation bias,” where users blindly trust a machine’s output simply because it is displayed in black and white.
By applying intentional color theory to model confidence, designers can bridge the gap between human intuition and machine probability. This is not merely an aesthetic choice; it is a critical communication strategy. When a user understands the “fuzziness” of an AI’s logic through color, they can make informed decisions, knowing exactly when to step in and apply their own human judgment.
Key Concepts
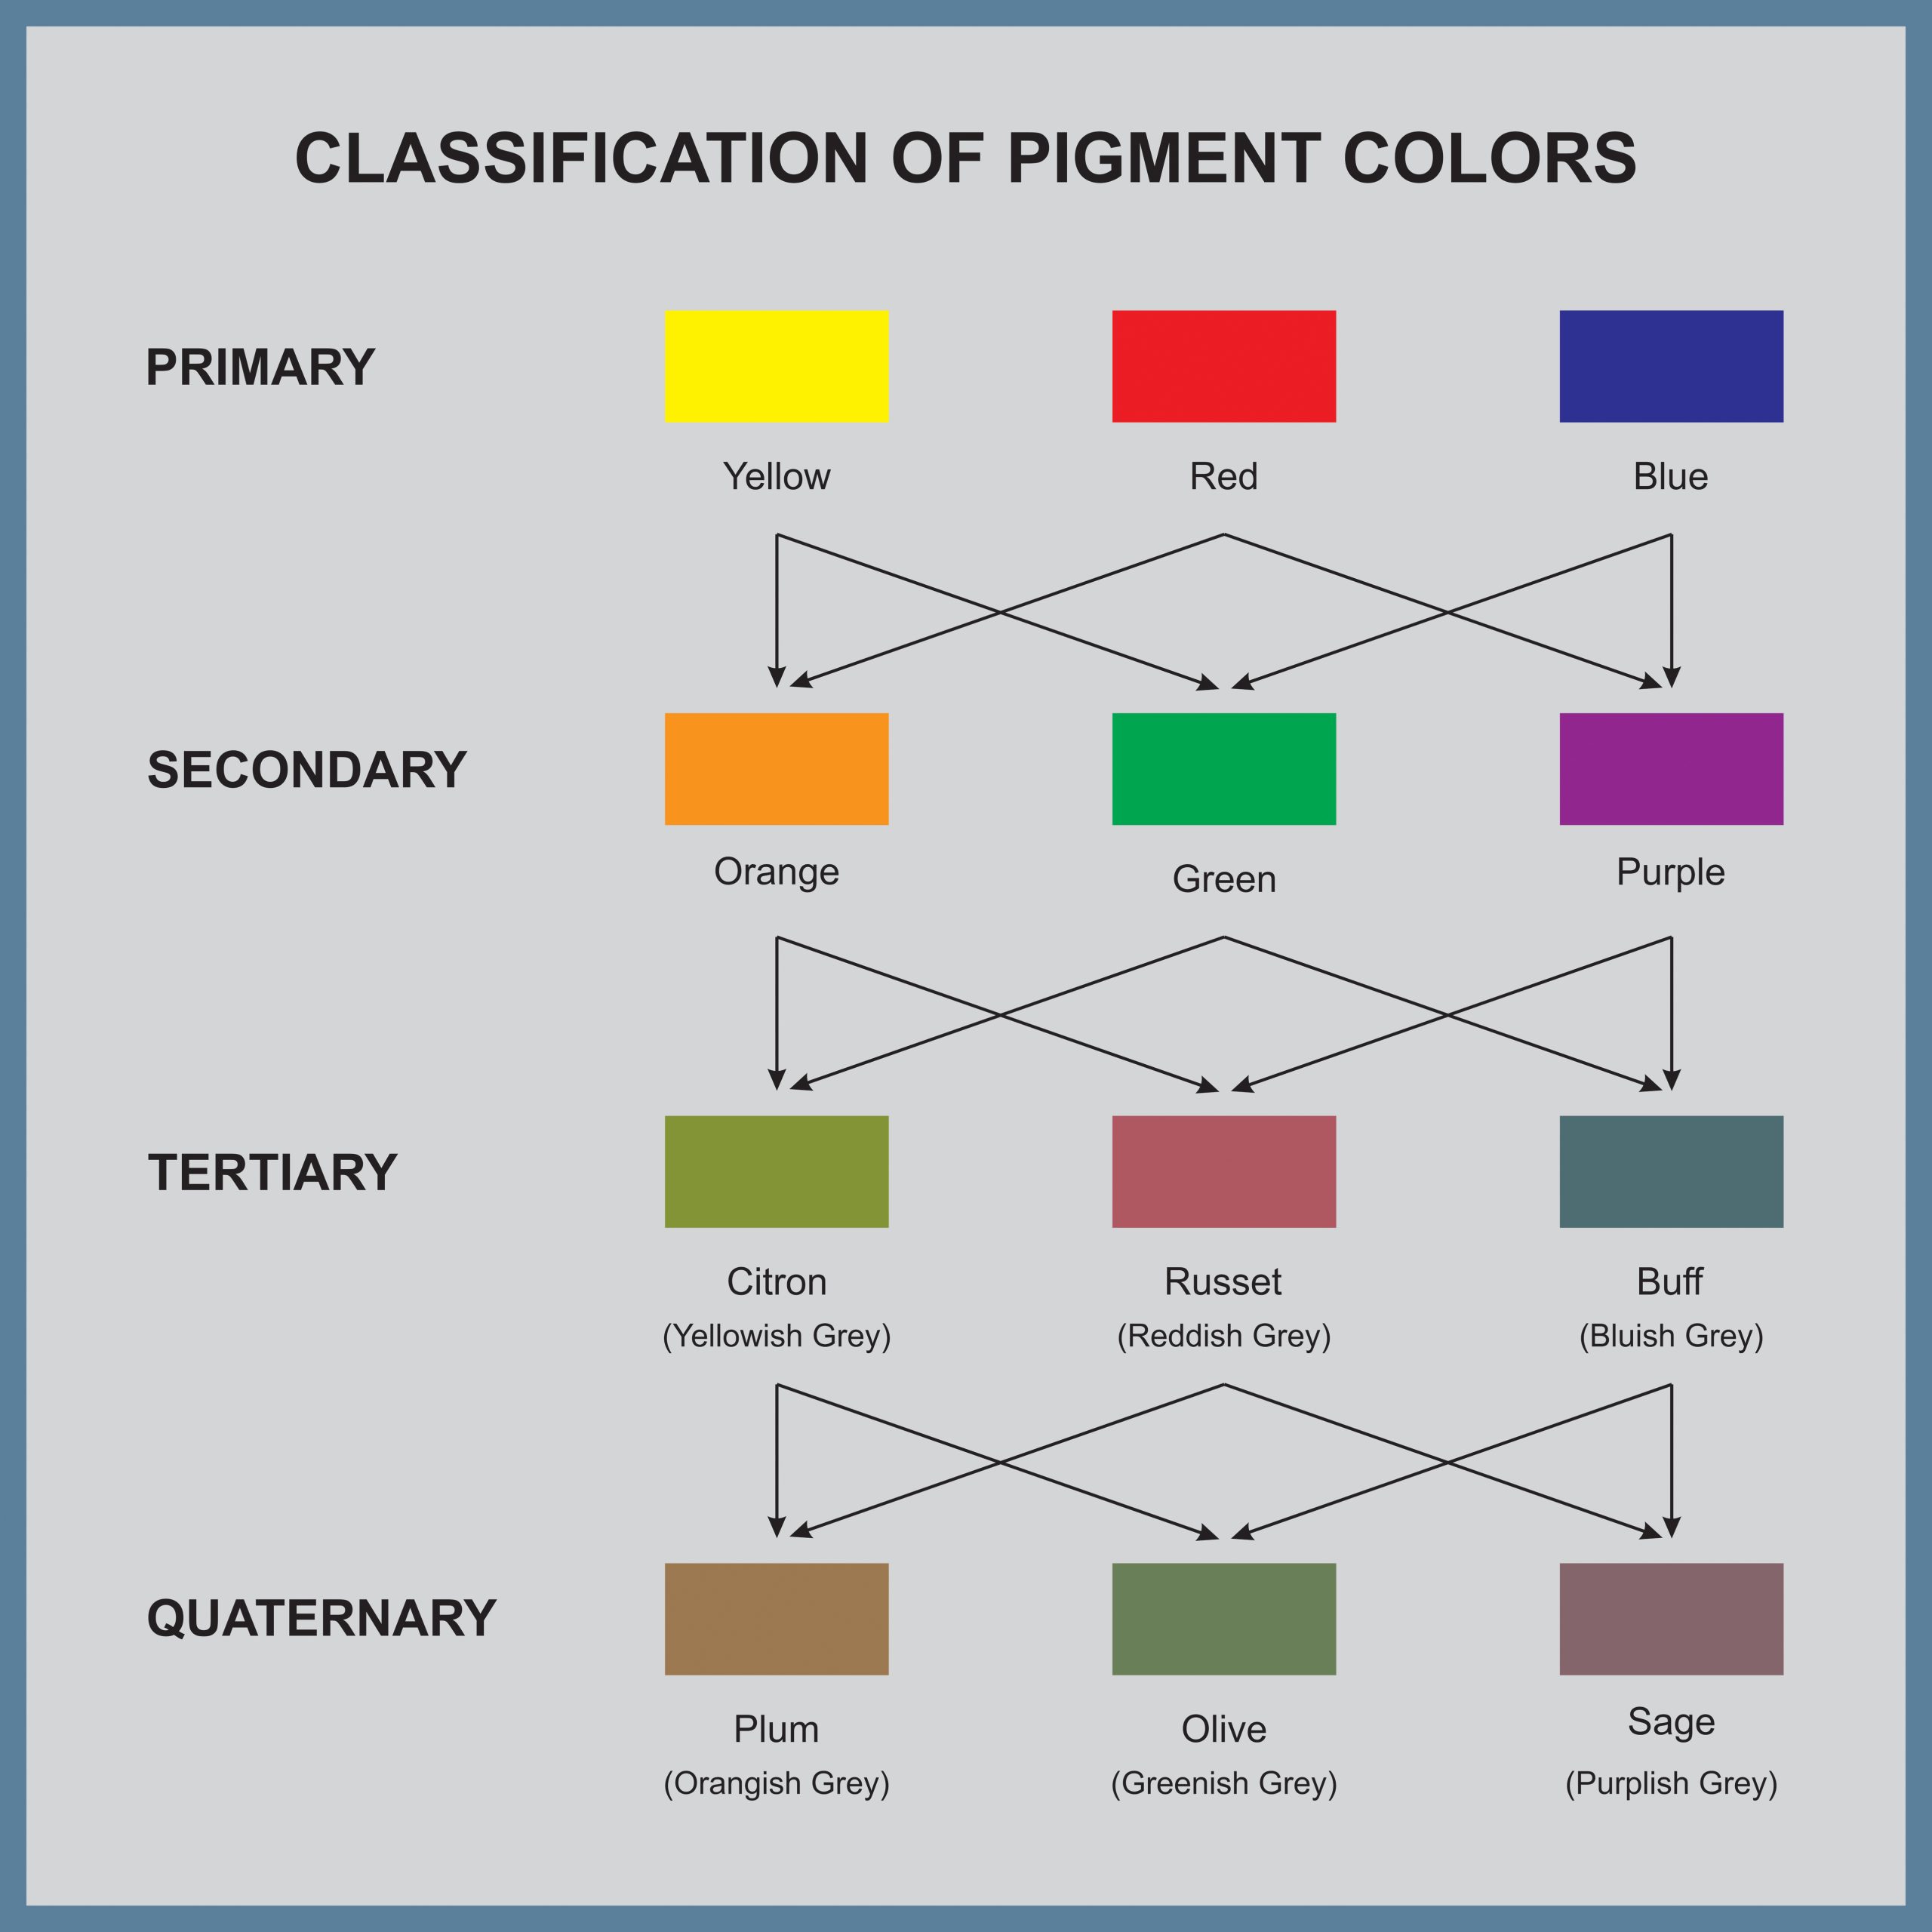
Color theory in the context of confidence levels relies on the principle of semantic color mapping. We are biologically and culturally conditioned to respond to specific hues: green signals safety or certainty, yellow warns of caution, and red indicates danger or high error probability.
To communicate confidence, you must shift from a fixed binary state (right/wrong) to a continuous scale. The core challenge is maintaining accessibility while managing a gradient of probability. Effective systems treat confidence as a secondary visual hierarchy, where the saturation or hue of the data element acts as an immediate, pre-attentive indicator of reliability.
Remember that human perception is non-linear. We perceive the difference between 90% and 95% confidence differently than we perceive the difference between 50% and 55%. Your color system must account for these perceptual jumps to ensure that “medium-low” confidence isn’t mistaken for “high” confidence by the user.
Step-by-Step Guide
Establish your confidence thresholds: Define the ranges for your model. For example, “High” (90-100%), “Medium” (70-89%), and “Low” (below 70%). These thresholds should be based on your model’s specific error tolerance.
Assign a color palette based on accessibility standards: Never rely on color alone. Use the WCAG 2.1 guidelines to ensure your colors are distinct even for users with color vision deficiencies. Pair colors with unique border styles, underline patterns, or icons.
Implement a saturation gradient: Instead of using drastically different colors for every percentage point, use varying levels of saturation within a single hue (e.g., deep blue for high confidence, lighter blue for lower confidence).
Design the “Unknown” state: Clearly define how the UI looks when the model has zero confidence. This should often be a neutral gray, signaling a “null” or “unprocessed” state to prevent users from inferring meaning where none exists.
User Testing: A/B test your interface with non-technical users. Ask them to identify which items the machine is “sure” about. If they struggle to distinguish the confidence levels, your color contrast or saturation spread is too subtle.
Real-World Applications
Medical Imaging: In radiology, an AI might highlight a potential tumor with a 92% confidence level. Using a solid, intense highlight color indicates high confidence, while a dashed, translucent overlay with a lower-saturation color warns the doctor to review that specific region more carefully. This prevents missed diagnoses due to over-reliance on the AI.
Financial Forecasting: In a dashboard showing future market trends, a “High Confidence” projection could be rendered in a bold, primary color. A “Low Confidence” forecast—perhaps based on volatile or missing data—should be rendered in a desaturated, muted tone. This visual distinction helps analysts identify where the model is operating outside its training distribution.
Customer Support Chatbots: If a chatbot provides an answer with low confidence, the text box could subtly shift its border color to amber. This acts as a silent cue for the user: “The bot isn’t sure, maybe I should ask a human agent or double-check this fact.”
Common Mistakes
Using Red for Everything: Many designers use red to signify “Low Confidence.” This is problematic because red is culturally linked to “Error” or “Urgent.” If the AI is just uncertain, you may inadvertently cause the user to panic rather than exercise caution. Use amber or muted yellows for uncertainty, and reserve red for critical system failures.
Ignoring Accessibility: Relying solely on color to communicate confidence is a failure of inclusive design. If a user has protanopia or deuteranopia, your green-to-red confidence scale becomes invisible. Always pair colors with text labels, patterns, or different font weights.
Over-Complication: Attempting to map 100 levels of confidence to 100 shades of a color is useless. The human eye cannot distinguish that many variations. Stick to three or four clear categories of confidence.
Inconsistent Scaling: If your “High Confidence” color changes its hue between different screens or modules within the same application, you destroy the user’s mental model. Consistency is the foundation of trust.
Advanced Tips
To truly elevate your design, move beyond simple color blocks. Micro-animations can be a powerful tool for indicating confidence. For example, a high-confidence prediction could appear with a sharp, static border, while a low-confidence prediction could have a subtle, pulsing animation to signify “searching” or “uncertainty.”
Additionally, consider the context of the input. If the user input is ambiguous (e.g., a poorly scanned document), the AI’s confidence will naturally be lower. Use a “confidence indicator” icon (like a speedometer or a shield) alongside the color. The icon provides a secondary visual anchor that reinforces the message conveyed by the color.
Lastly, implement progressive disclosure. When a user hovers over a low-confidence item, show a small tooltip explaining why the model is uncertain. Color is the “attention grabber,” but the label is the “explanation.” By linking color to data-driven justifications, you build a high-trust, high-utility relationship between the human and the AI system.
Conclusion
Applying color theory to model confidence is one of the most effective ways to humanize artificial intelligence. By acknowledging that models are not omniscient, you build an interface that feels honest, transparent, and user-centric.
Effective design is not just about making things look good; it is about communicating the truth of the system. Whether you are building complex data dashboards or simple consumer tools, remembering that “color is information” will help your users navigate the probabilistic nature of modern software. Start small, test often, and always keep your users’ ability to interpret uncertainty at the heart of your visual strategy.


Leave a Reply