Contents
* Introduction: The “Black Box” problem in deep learning and how attention mechanisms offer a window into model logic.
* Key Concepts: Defining Self-Attention, Query/Key/Value matrices, and how the Softmax output creates a “heatmap” of information flow.
* Step-by-Step Guide: A technical workflow for extracting and visualizing attention weights using libraries like Hugging Face `transformers`.
* Real-World Applications: How this is used in debugging, domain adaptation, and legal/medical document analysis.
* Common Mistakes: The “Attention is not Explanation” fallacy and why correlation doesn’t always equal causality.
* Advanced Tips: Moving beyond static visualizations to dynamic interpretation, using integrated gradients, and analyzing multi-head behavior.
* Conclusion: Balancing the utility of visualization with the need for rigorous statistical validation.
***
Beyond the Black Box: Leveraging Attention Mechanisms for Model Interpretability
Introduction
For years, the field of deep learning has been haunted by the “black box” critique. When a Transformer-based model classifies a document or generates a piece of text, we often have little insight into why it made that decision. In high-stakes industries like healthcare, finance, and law, this lack of transparency is a non-starter. However, the architecture that powers modern AI—the Transformer—contains a built-in mechanism that offers a compelling solution: Attention.
Attention mechanisms are not merely mathematical tricks to improve accuracy; they are structured maps of how a model processes information. By visualizing attention weights, developers and data scientists can literally see what parts of the input a model prioritizes. This article explores how to harness these weights to demystify your models, diagnose errors, and build trust in your AI deployments.
Key Concepts
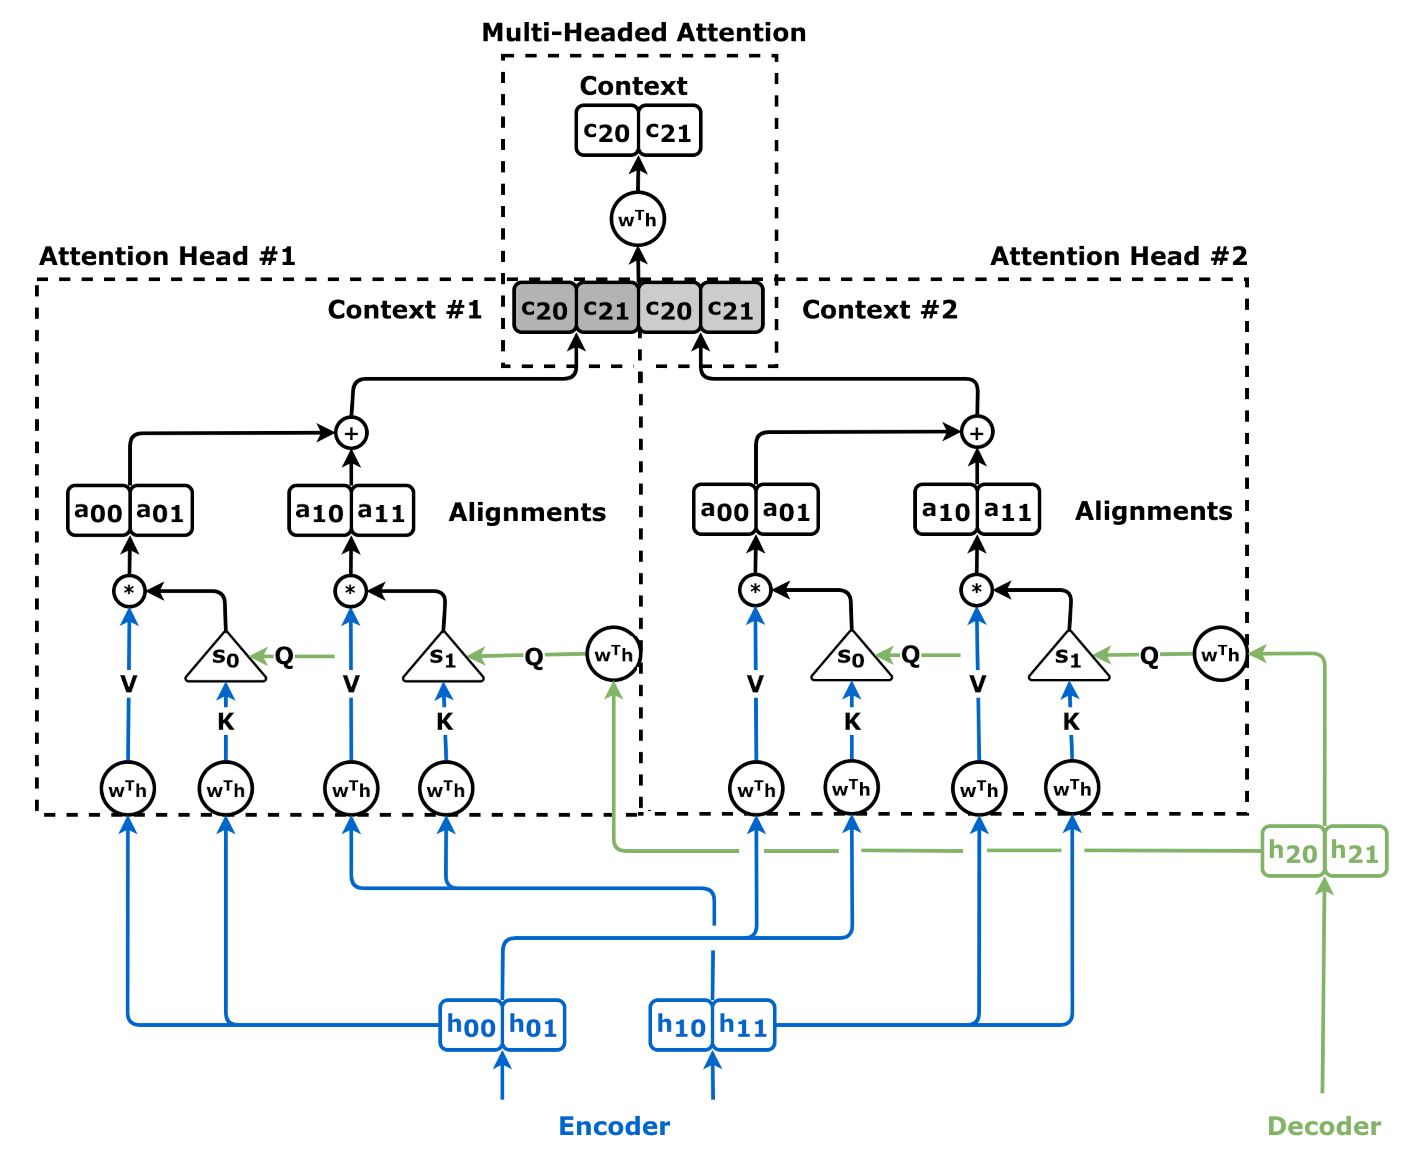
At the heart of every Transformer is the Scaled Dot-Product Attention mechanism. To understand how this provides interpretability, we must understand the core components:
- Query (Q), Key (K), and Value (V): Think of this as a database retrieval system. The Query is what the current token is looking for; the Key is a label for information available in other tokens; the Value is the actual content associated with that information.
- The Attention Score: The dot product of Q and K determines the relevance of one token to another. A higher score means the model is “paying more attention” to that specific relationship.
- Softmax Normalization: This converts raw scores into probabilities that sum to one. These probabilities, or “weights,” are what we visualize.
When you visualize these weights, you are effectively looking at a connectivity graph. If a model is translating the word “bank” in a sentence, the attention weights reveal whether the model is focusing on “river” or “money,” providing a clear trace of the model’s semantic reasoning.
Step-by-Step Guide: Extracting and Visualizing Attention
To turn raw weights into actionable insights, follow this technical workflow using the Hugging Face `transformers` ecosystem.
- Configure the Model for Output: When loading your model, ensure the output_attentions flag is set to True. This instructs the model to return the attention weights along with the standard logits.
- Perform Inference: Run your input sequence through the model. You will receive an object containing a list of tensors, where each tensor corresponds to a layer in the model.
- Normalize and Shape: The attention tensor usually has the shape (Batch, Heads, Sequence Length, Sequence Length). You will need to aggregate across the Heads (e.g., taking the mean) to get a single view per layer.
- Heatmap Generation: Use libraries like Matplotlib or Seaborn to plot these weights as a matrix. The X-axis represents the source tokens, and the Y-axis represents the target tokens.
- Interpretive Overlay: For user-facing tools, consider using highlighting techniques where the background intensity of text changes based on the aggregated attention score for a specific focus token.
Examples and Case Studies
Case Study 1: Medical Document Analysis
In clinical NLP, a model may be tasked with summarizing patient notes. By visualizing attention, doctors can verify that the model is anchoring its summary on critical diagnostic data (e.g., blood pressure levels) rather than irrelevant noise (e.g., administrative codes). If the attention weights highlight irrelevant tokens, it serves as a red flag that the model requires fine-tuning on domain-specific corpora.
Case Study 2: Legal Contract Review
Law firms use Transformers to identify “risky” clauses in contracts. Visualization allows human lawyers to audit the AI’s logic. If the model flags a clause as high-risk, the lawyer can click on the flagged text. If the visualization shows the model is paying attention to keywords like “indemnity” or “termination,” the lawyer can confirm the AI is applying the correct legal heuristics.
Common Mistakes
- The “Attention is not Explanation” Fallacy: It is dangerous to assume that attention is a 1:1 mapping of human logic. Attention weights are learned proxies, not necessarily explicit reasoning steps. High attention does not always mean a token is “important”—it can sometimes mean the model is trying to filter out noise.
- Ignoring Multi-Head Dynamics: Modern Transformers have dozens of heads. Looking at only the first head or the average of all heads often obscures the nuance. Some heads specialize in syntax (grammar), while others specialize in coreference (entities). You must analyze specific heads to understand specific behaviors.
- Over-Smoothing: In very deep networks, attention weights can become diffuse as you move toward the final layers. Visualization is often most effective in the middle-to-lower layers where semantic relationships are still being formed.
Advanced Tips
To move from simple visualization to true insight, consider these strategies:
“True interpretability lies not in staring at heatmaps, but in testing the sensitivity of the model to perturbations.”
Integrated Gradients: Supplement attention visualizations with feature attribution methods like Integrated Gradients. This allows you to see how much the output changes if you remove specific tokens, effectively “stress-testing” your attention maps.
Pruning for Efficiency: Use attention weights to identify “dead” heads—those that assign equal weight to everything or nothing. By pruning these heads, you can often shrink the model size and increase inference speed without sacrificing performance, using the attention visualization as a diagnostic tool for model pruning.
Attention Flow: Instead of looking at a single layer, use “Attention Rollout” or “Attention Flow.” These techniques track how information propagates through the entire stack of layers, giving you a holistic view of the dependency chain from input to output.
Conclusion
Attention mechanisms offer a significant leap forward in our ability to interpret Transformer-based models. By converting abstract neural operations into visual matrices, we move away from the “black box” and toward a paradigm of collaborative AI, where human operators can audit, debug, and improve models with surgical precision.
However, interpretability is not a single point of data; it is a discipline. Use attention visualizations as a starting point for inquiry, not as a definitive verdict. Combine these visual tools with robust evaluation metrics, sensitivity analysis, and human-in-the-loop auditing to ensure your AI systems are not just accurate, but reliably explainable.
Further Reading


 extends CAM to architectures without global pooling.")


Leave a Reply