Attention visualization identifies which segments of input data, such as tokens in text, receive higher weights.
— by
Steven Haynes
Contents
1. Introduction: Defining the “black box” of AI and why visibility into the attention mechanism is critical for model transparency and performance.
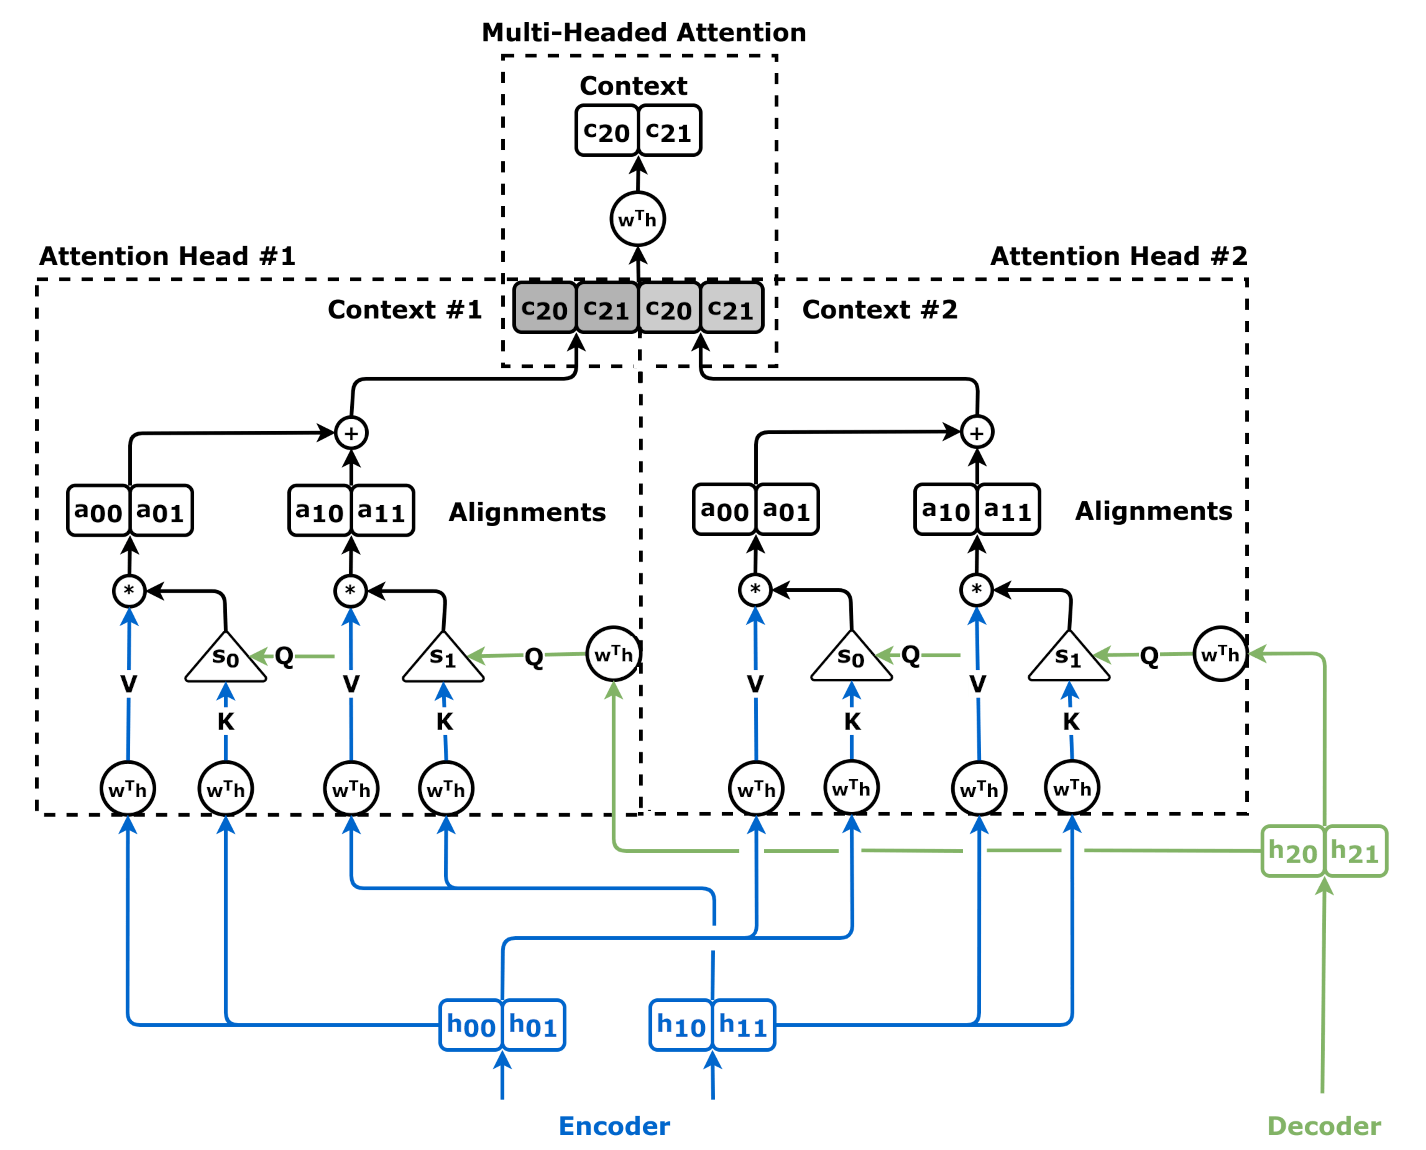
2. Key Concepts: Understanding Transformer architectures, self-attention mechanisms, and how weight matrices translate to visual importance maps.
3. Step-by-Step Guide: Implementing attention visualization using standard Python libraries (Hugging Face, BertViz).
4. Examples and Case Studies: Analyzing linguistic ambiguity (e.g., coreference resolution) and debugging model bias.
5. Common Mistakes: The fallacy of “attention as explanation” and misinterpreting weight magnitude vs. feature importance.
6. Advanced Tips: Moving beyond single-head visualization to multi-head analysis and integrated gradients.
7. Conclusion: Bridging the gap between model interpretability and reliable AI deployment.
***
Peering Into the Black Box: How Attention Visualization Reveals AI Logic
Introduction
Artificial Intelligence, particularly the Transformer architecture powering models like GPT-4 and BERT, has revolutionized how we process language. Yet, for all its power, these models remain notoriously difficult to interpret. They are often dismissed as “black boxes”—systems where we feed inputs into one end and receive outputs from the other, with little understanding of the internal reasoning process.
Attention visualization changes this dynamic. By extracting and mapping the attention weights assigned to specific tokens during the inference process, practitioners can peek inside the neural network. This transparency is not just an academic exercise; it is a vital tool for debugging model performance, identifying bias, and ensuring that your model is “looking” at the right information to make its decisions.
Key Concepts
At the heart of modern Natural Language Processing (NLP) is the Self-Attention Mechanism. In simple terms, attention allows a model to weigh the importance of different words in a sentence relative to one another. When the model processes the word “bank” in the sentence “The bank decided to lower interest rates,” the attention mechanism ensures the model assigns high weight to “interest rates” and “lower,” effectively disambiguating “bank” as a financial institution rather than a river bank.
Attention Weights are the numerical values that quantify this relationship. During training, the model learns a series of matrices (Query, Key, and Value) that compute these scores. When we perform attention visualization, we extract these scores and translate them into a visual format—usually a heatmap—where color intensity corresponds to the strength of the attention.
By visualizing these weights, we turn abstract mathematical tensors into human-readable patterns. We can see which tokens the model is focusing on to generate the next word in a sequence or to classify a specific piece of text.
Step-by-Step Guide
Visualizing attention is more accessible than ever thanks to open-source libraries. Follow this workflow to start interpreting your own models.
Choose your toolkit: For developers, BertViz is the industry standard for visualizing attention in Hugging Face Transformer models. Install it via pip: pip install bertviz.
Select the model and task: Choose a pre-trained model (e.g., bert-base-uncased or distilgpt2) that fits your use case. Ensure the model supports attention output extraction.
Initialize the model and tokenizer: Use the Hugging Face transformers library to load your configuration, explicitly setting output_attentions=True. This flag is crucial; without it, the model will not return the weights you need to visualize.
Perform the inference: Pass your input text into the model. Instead of just receiving the final prediction, you will now receive a tuple containing the hidden states and the attention weights.
Generate the visualization: Pass the attention weights and tokenized text into a visualization function. If using BertViz, the head_view function will automatically create an interactive dashboard in your Jupyter Notebook, allowing you to hover over tokens to see the connections drawn between them.
Interpret the heatmaps: Look for “diagonal” patterns (where tokens attend to themselves), “vertical” lines (where specific tokens like punctuation act as focal points), and “blocked” patterns (where syntactic groups form, such as noun phrases).
Examples and Case Studies
Coreference Resolution: Consider a sentence with complex pronouns: “The trophy would not fit into the brown suitcase because it was too large.” A human knows “it” refers to the trophy. Through attention visualization, you can verify if your model assigns the highest attention weight to “trophy” when processing the word “it.” If the model attends primarily to “suitcase,” you know your model is logically flawed.
Debugging Model Bias: In recruitment algorithms, you might find that a model is classifying resumes based on gender-coded language. By visualizing attention weights, you might discover that the model assigns massive weight to pronouns or gendered titles rather than the professional experience listed. Seeing this “attention leakage” allows you to modify your training data or apply regularization techniques to suppress the influence of those specific tokens.
Common Mistakes
Assuming Attention Equals Explanation: A major trap for developers is the belief that “attention is explanation.” High attention weight does not always mean the model is using that token as a causal reason for its decision. It is merely a signal of what the model is looking at; further validation, such as saliency maps or feature ablation, is required to prove causality.
Ignoring Multi-Head Dynamics: Modern models use multiple “heads” of attention, each learning different relationships. Looking at only one head can be misleading. Always use tools that allow you to aggregate or cycle through different heads to get a comprehensive view of the model’s focus.
Focusing on Local Context Only: Beginners often look only at immediate neighbors. In reality, Transformers are designed to look globally. If you see attention jumping across the entire document to a token five paragraphs back, don’t dismiss it as noise—it might be the key to the model’s long-range memory.
Advanced Tips
To move from basic visualization to deep analysis, consider these approaches:
Integrated Gradients combined with Attention: While attention tells you which tokens the model is looking at, Integrated Gradients tell you how much each token contributed to the final prediction. Overlaying these two techniques provides a “gold standard” for interpretability.
Another advanced technique involves Attention Rollout. Because attention is computed at every layer of a Transformer, simple visualization shows you only what is happening at a single layer. Attention Rollout recursively multiplies the attention matrices across layers to track how information flows from the input layer all the way to the output. This reveals the “path” that information takes through the network, providing a much clearer picture of complex reasoning tasks.
Finally, always perform Comparative Visualization. Compare the attention maps of a model before and after fine-tuning. Seeing how the “attention surface” changes as the model learns your specific domain data is one of the most effective ways to determine if the fine-tuning process is working as intended.
Conclusion
Attention visualization is more than just a aesthetic feature for research papers; it is a practical necessity for anyone deploying AI in high-stakes environments. By mapping the internal connections of Transformers, we move from blindly trusting model outputs to understanding the logic—and the potential pitfalls—of our systems.
While attention maps are not a perfect, one-to-one mapping of human logic, they are the most effective tool we currently have for “peering under the hood.” Use these insights to debug your models, refine your training data, and ultimately build AI systems that are not only powerful but also transparent and reliable. As you continue to experiment, remember: look for the patterns, be wary of simple explanations, and always validate your findings with rigorous testing.


Leave a Reply